Musical379 films |
Quelques chiffres
Cumul Recettes7 475 318 538 $
Nombre de films +100 000 000 $17
| Nb Films | Recettes | |
2020 - 2029 |
34 | 1 219 389 563 $ |
2010 - 2019 |
50 | 1 595 062 893 $ |
2000 - 2009 |
68 | 1 316 099 562 $ |
1990 - 1999 |
15 | 289 463 465 $ |
1980 - 1989 |
45 | 1 148 851 525 $ |
1970 - 1979 |
33 | 992 716 536 $ |
1960 - 1969 |
40 | 597 739 757 $ |
1950 - 1959 |
72 | 212 474 000 $ |
1940 - 1949 |
19 | 91 220 000 $ |
1930 - 1939 |
2 | 10 700 000 $ |
Evolution dans le temps |
||
Titre |
Sortie | Démarrage | Cumul Entrées | ||
|
1 |

|
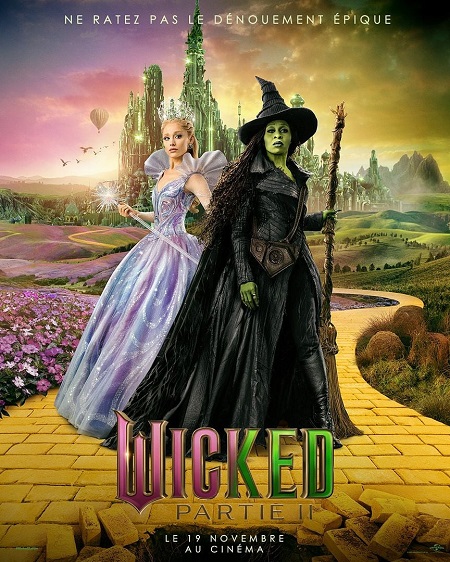
Wicked |
22/11/2024 | 112 508 890 $ | 474 983 975 $ |
|
2 |
|
Wicked : partie II |
21/11/2025 | 147 004 640 $ | 342 915 090 $ |
|
3 |

|
A Star is Born (2018) |
05/10/2018 | 42 908 051 $ | 215 288 866 $ |
|
4 |

|
The Greatest Showman |
20/12/2017 | 8 805 843 $ | 174 340 174 $ |
|
5 |

|
Chicago |
24/01/2003 | 8 238 709 $ | 170 684 505 $ |
|
6 |
|
Grease |
16/06/1978 | 8 941 717 $ | 159 978 870 $ |
|
7 |

|
La Mélodie du bonheur |
02/03/1965 | - $ | 158 671 368 $ |
|
8 |

|
La La Land |
25/12/2016 | 5 751 708 $ | 151 101 803 $ |
|
9 |

|
Elvis (2022) |
24/06/2022 | 31 211 579 $ | 151 040 048 $ |
|
10 |

|
Les Misérables (2013) |
25/12/2012 | 27 281 735 $ | 148 809 770 $ |
|
11 |

|
Mamma Mia! |
18/07/2008 | 27 751 240 $ | 143 704 210 $ |
|
12 |

|
The Rocky Horror Picture Show |
26/09/1975 | - $ | 139 876 417 $ |
|
13 |

|
La Fièvre du samedi soir |
16/12/1977 | 3 878 099 $ | 139 486 124 $ |
|
14 |

|
Into the Woods |
25/12/2014 | 31 051 923 $ | 128 002 372 $ |
|
15 |
|
Mamma Mia 2: Here We Go Again! |
20/07/2018 | 34 952 180 $ | 120 634 935 $ |
|
16 |

|
Hairspray (2007) |
20/07/2007 | 27 476 745 $ | 118 823 091 $ |
|
17 |
|
Dreamgirls |
25/12/2006 | 14 100 050 $ | 103 338 338 $ |
|
18 |

|
Rocketman |
31/05/2019 | 25 725 722 $ | 96 368 160 $ |
|
19 |

|
Flashdance |
15/04/1983 | 4 076 124 $ | 92 921 203 $ |
|
20 |

|
Un violon sur le toit |
03/11/1971 | - $ | 90 900 000 $ |
|
21 |

|
High School Musical 3 |
24/10/2008 | 42 030 184 $ | 90 556 401 $ |
|
22 |

|
Annie (2014) |
19/12/2014 | 15 861 939 $ | 85 911 262 $ |
|
23 |

|
Footloose |
17/02/1984 | 8 556 935 $ | 80 035 402 $ |
|
24 |

|
Une étoile est née |
17/12/1976 | 7 000 245 $ | 74 200 000 $ |
|
25 |

|
My Fair Lady |
21/10/1964 | - $ | 72 000 000 $ |
|
26 |

|
La Cage aux poules |
23/07/1982 | 11 874 268 $ | 69 701 637 $ |
|
27 |
|
Purple Rain |
27/07/1984 | 7 766 201 $ | 68 392 977 $ |
|
28 |

|
Nashville Lady |
07/03/1980 | 6 788 544 $ | 67 182 787 $ |
|
29 |

|
Sexy Dance |
11/08/2006 | 20 659 573 $ | 65 269 010 $ |
|
30 |
|
Staying Alive |
15/07/1983 | 12 146 143 $ | 64 892 670 $ |
|
31 |

|
Dirty Dancing |
21/08/1987 | 3 900 000 $ | 63 446 382 $ |
|
32 |

|
Steppin' |
12/01/2007 | 21 833 312 $ | 61 356 221 $ |
|
33 |
|
La Couleur Pourpre (2024) |
25/12/2023 | 11 737 072 $ | 60 619 191 $ |
|
34 |

|
Sexy Dance 2 |
14/02/2008 | 18 908 826 $ | 58 006 147 $ |
|
35 |

|
Moulin Rouge |
01/06/2001 | 13 718 306 $ | 57 346 683 $ |
|
36 |

|
The Blues Brothers |
20/06/1980 | 4 858 152 $ | 57 229 890 $ |
|
37 |
|
Annie |
18/06/1982 | 5 312 062 $ | 57 059 003 $ |
|
38 |

|
La Bamba |
24/07/1987 | 5 651 990 $ | 54 215 416 $ |
|
39 |

|
Sweeney Todd |
21/12/2007 | 9 300 805 $ | 52 882 759 $ |
|
40 |

|
Funny Girl |
18/09/1968 | - $ | 52 000 000 $ |
|
41 |

|
Footloose (2011) |
14/10/2011 | 15 556 113 $ | 51 802 742 $ |
|
42 |
|
Le Fantôme de l'Opéra |
22/12/2004 | 4 001 890 $ | 51 225 796 $ |
|
43 |

|
Evita |
10/01/1997 | 8 381 055 $ | 50 047 179 $ |
|
44 |
|
Oliver! |
26/09/1968 | - $ | 48 000 000 $ |
|
45 |

|
Jersey Boys |
20/06/2014 | 13 319 371 $ | 47 047 013 $ |
|
46 |

|
West Side Story |
18/10/1961 | - $ | 43 656 822 $ |
|
47 |

|
Sexy Dance 3D |
06/08/2010 | 15 812 311 $ | 42 352 503 $ |
|
48 |

|
Soleil de nuit |
22/11/1985 | 4 549 095 $ | 42 160 849 $ |
|
49 |

|
Cabaret |
00/02/1972 | - $ | 41 326 446 $ |
|
50 |

|
Street dancers |
30/01/2004 | 16 123 105 $ | 40 302 351 $ |